
In the Digital Apprenticeship project we plan to explore whether Jisc can build a tracking, monitoring and reporting system for apprenticeships that provides a provider dashboard, an employer dashboard and an app for apprentices.
With any project it is important that all members of the project team have a shared understanding of the technical structure of what we are trying to achieve.
One way we can do this is through a simple diagram (in this example created using Sharpies) and ensure that it covers what we want to do and from there then move to a more planned and technical approach to the data infrastructure.
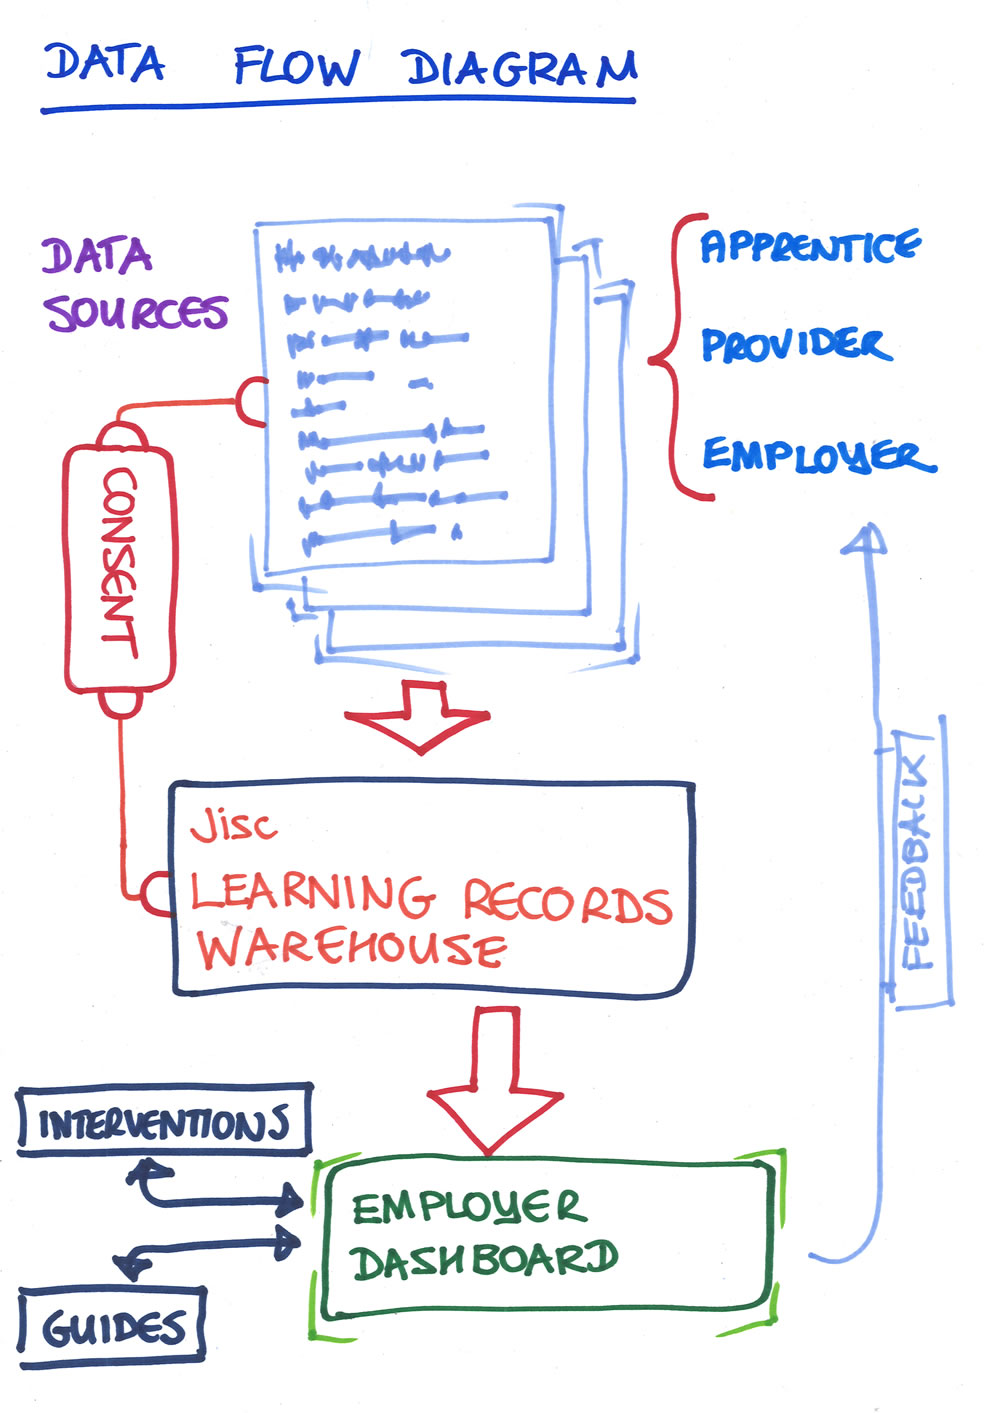
Following the first draft of this diagram, we recognised the need for consent.
There are three levels of consent, consent to collect data, consent to process data and consent to action on data.
From the perspective of the employer dashboard this could be seen as collecting data on VLE usage, processing that data and presenting it on a dashboard and finally presenting that dashboard to employers with a list of actions or possible interventions.
We are working now on the data structures required for the apprenticeship work.